The analytics displayed on the Dashboard of your Journo Portfolio account are great for a quick snap-shot of your sites analytics and how it is performing, but you can get much more detailed and sophisticated reporting by integrating directly with Google Analytics.
Head to https://analytics.google.com/analytics/ and click login or create an account. You will need a Google Account.
Once logged in you need to go to the Admin area of the site, if you're not there already the link is at the bottom left in the sidebar.

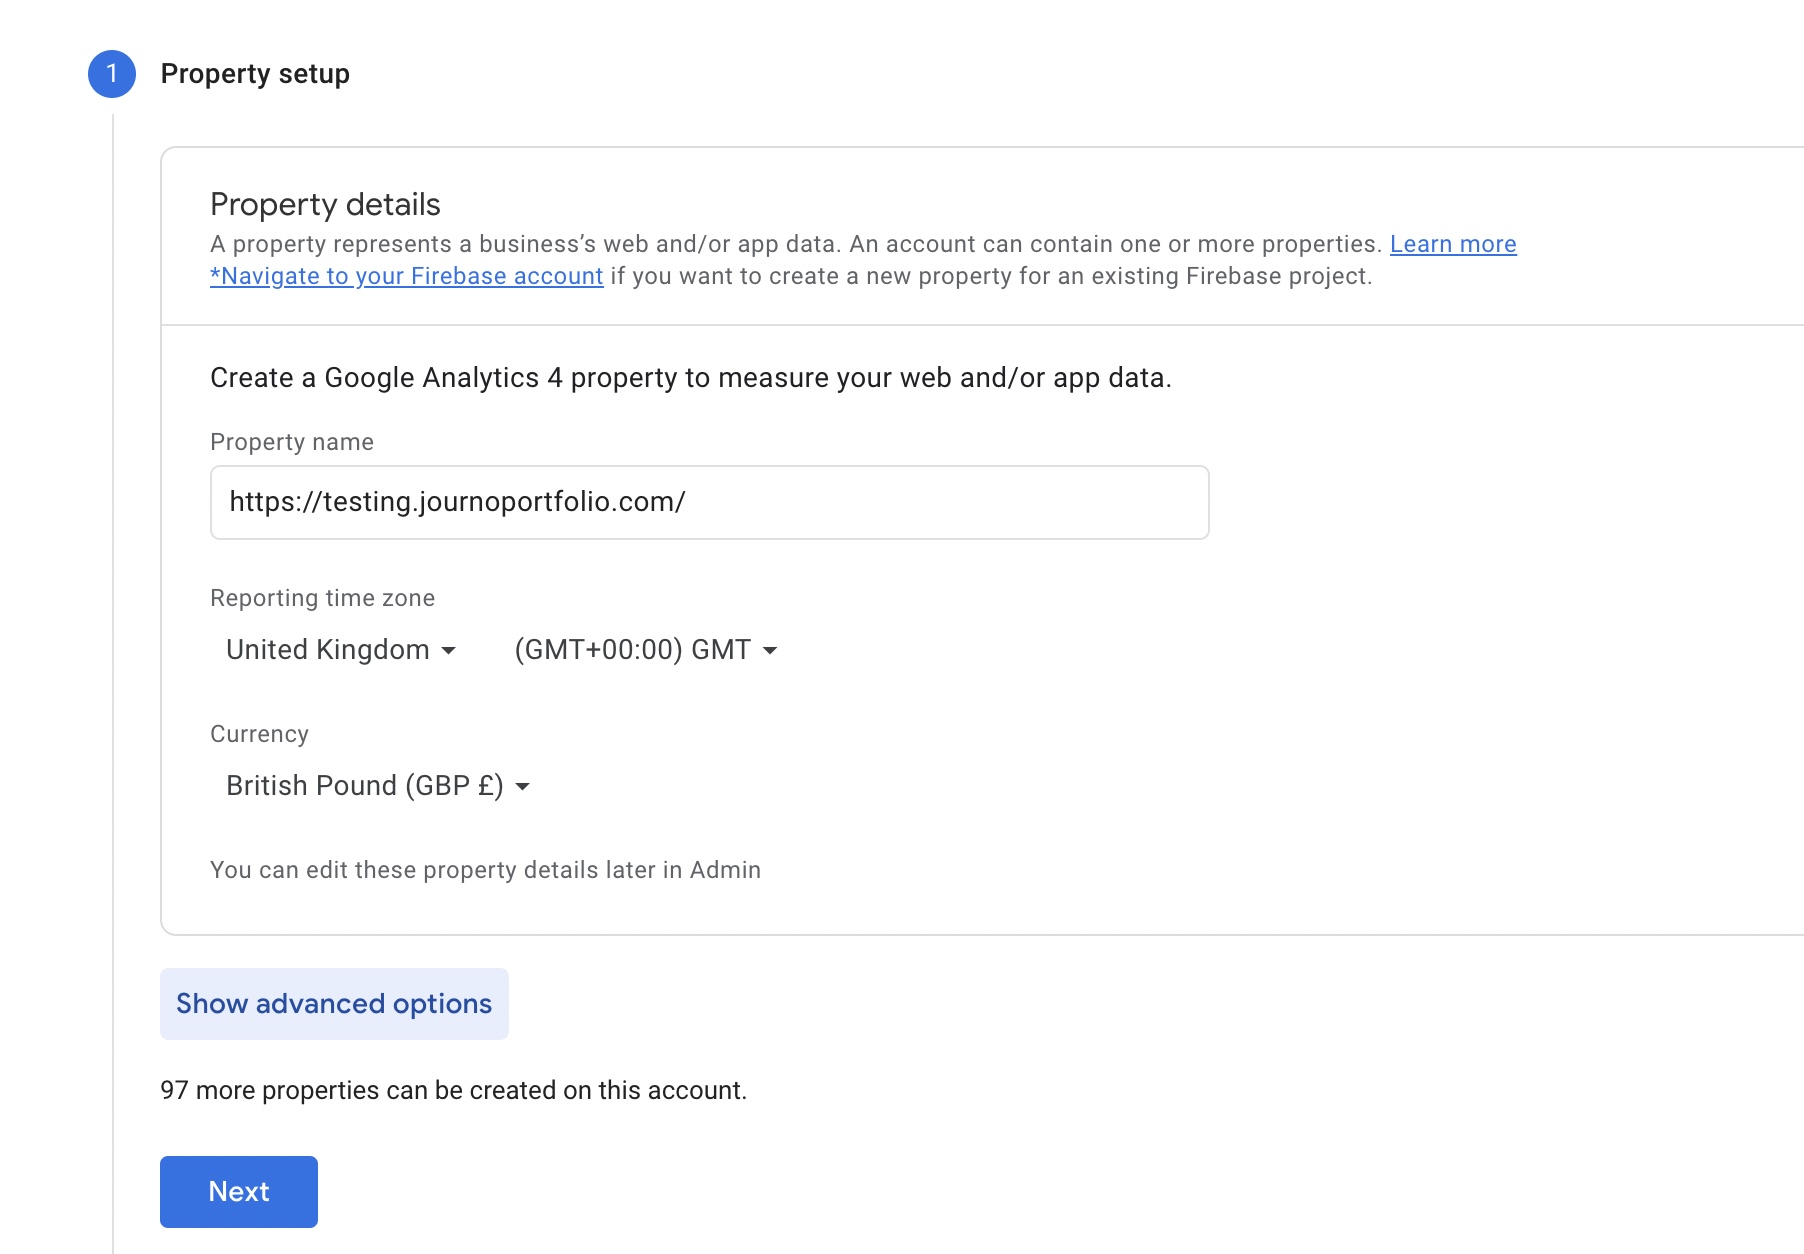
Under 'Property' in the middle column, select the drop down and click 'Create a new property'.

Copy your portfolio URL exactly as it appears on your home page. Don't include anything at the end like /about/.
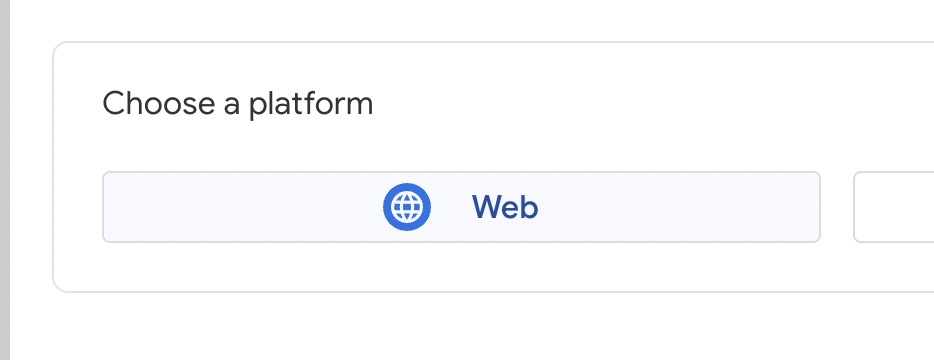
Choose the 'Website' option to configure the stream for collecting data.
You don't need to fill in the Industry and can just click 'Get Tracking ID'.
Enter your full portfolio URL under the "Website URL" field:
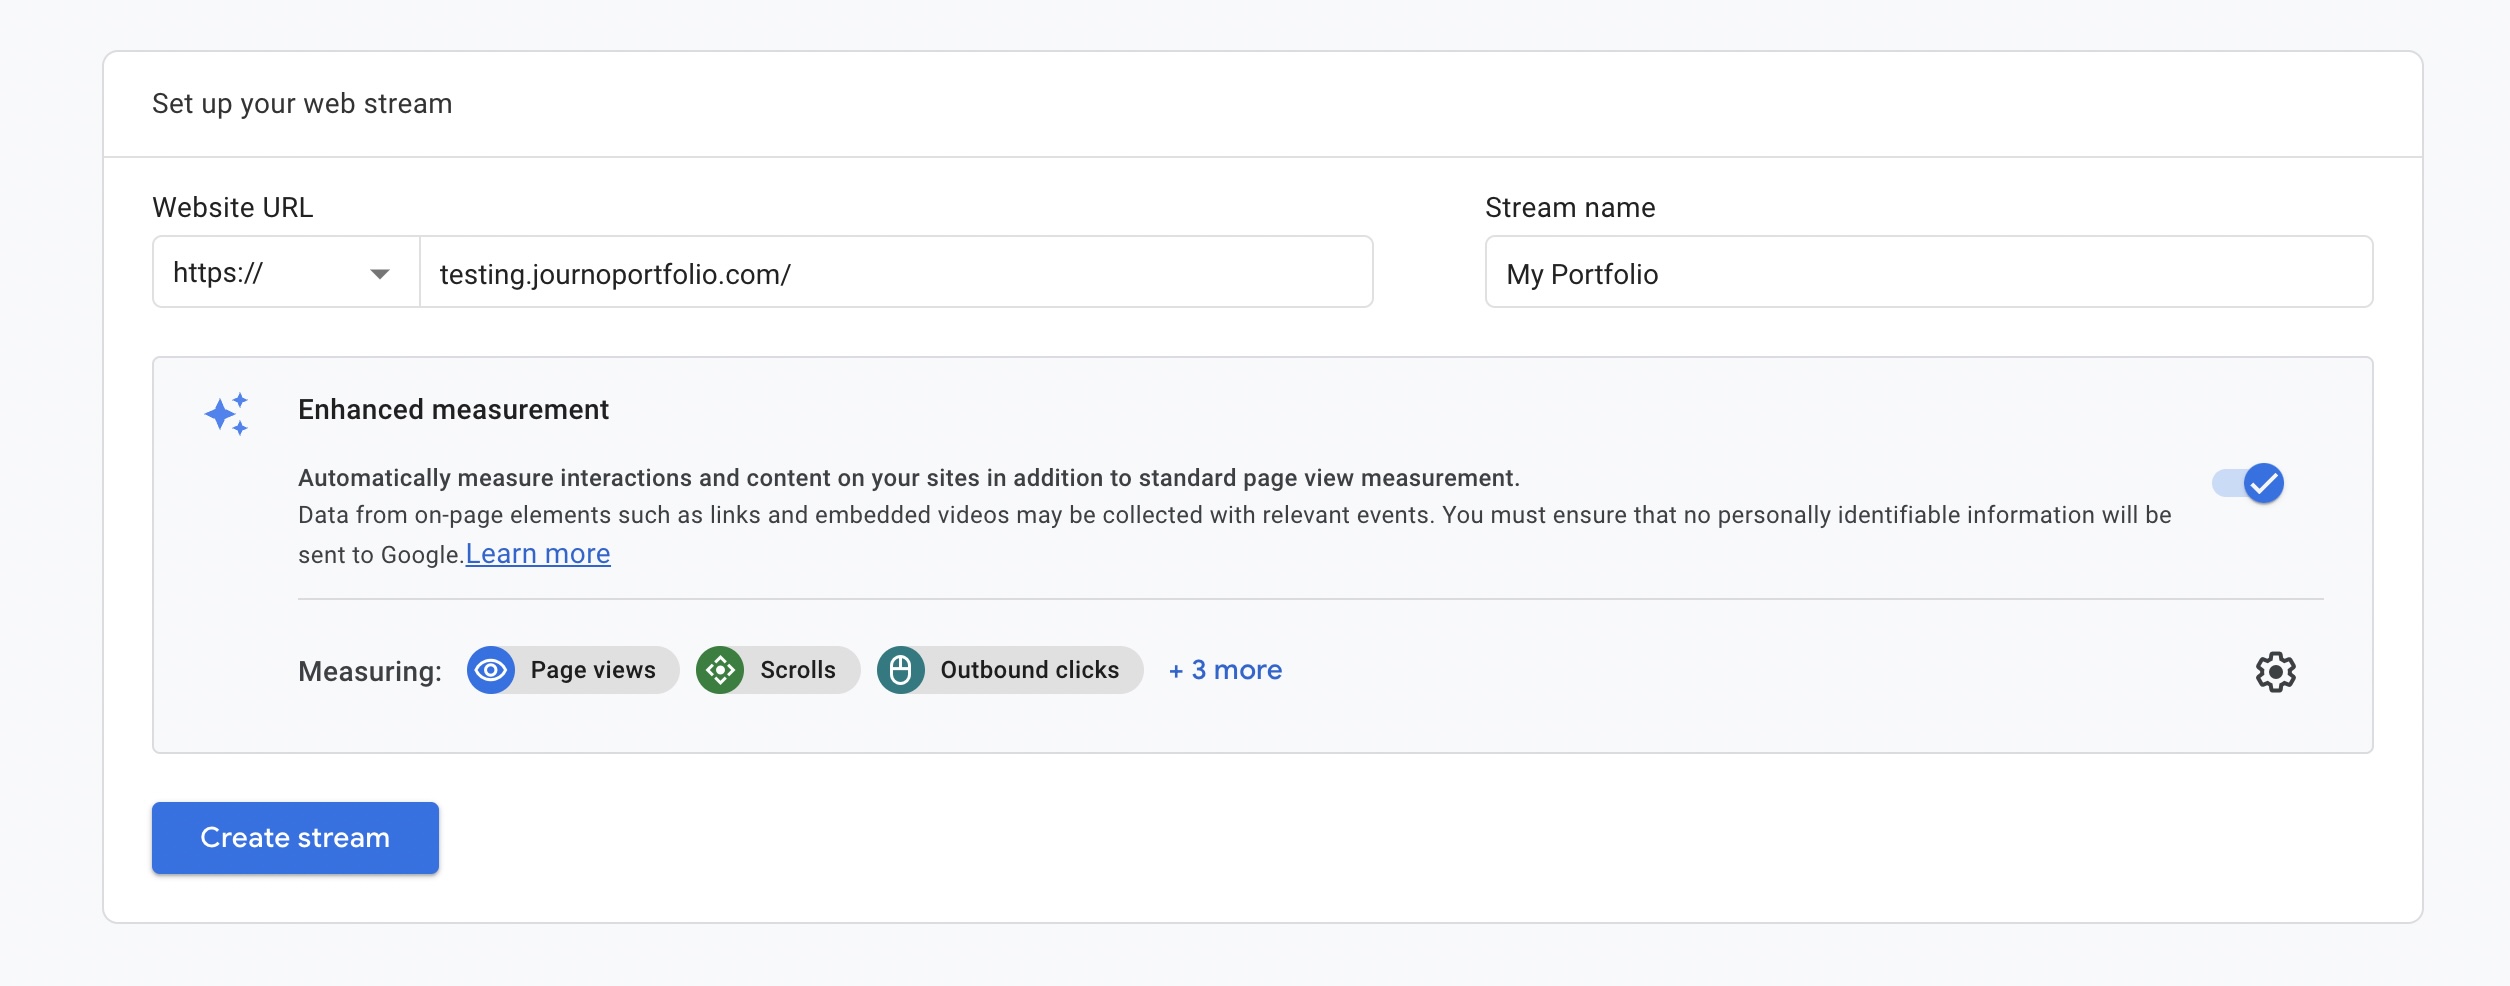
Click "Create Steam"
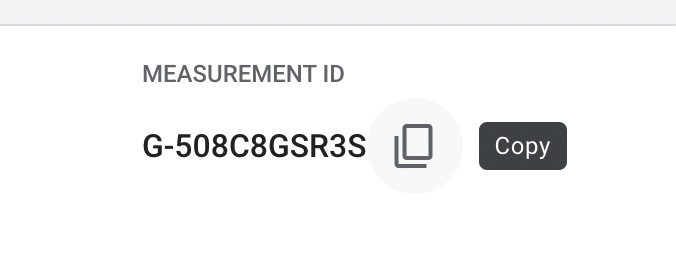
All you need is your 'Measurement ID' that Google provides. You don't need any code. Copy it.
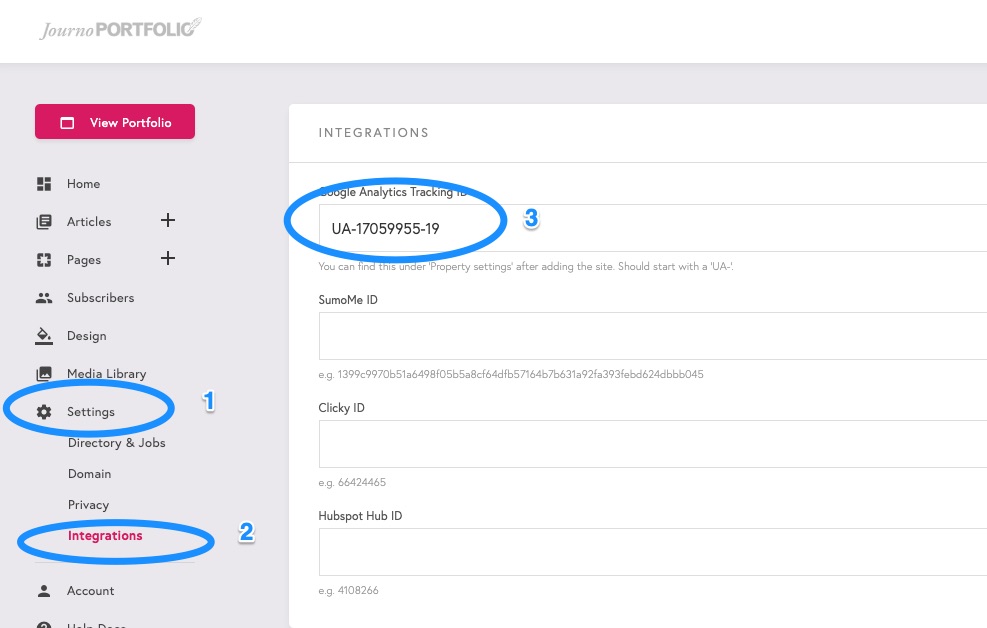
Login to the dashboard and click 'Settings' in the left sidebar, then click 'Integrations' below.
Enter you code (starting 'G-') into the first field, and then click Save at the top.
All Set!
Allow 24 hours for your data to start coming in and you should have access to where people came from, what they did on your site and other relevant data.
